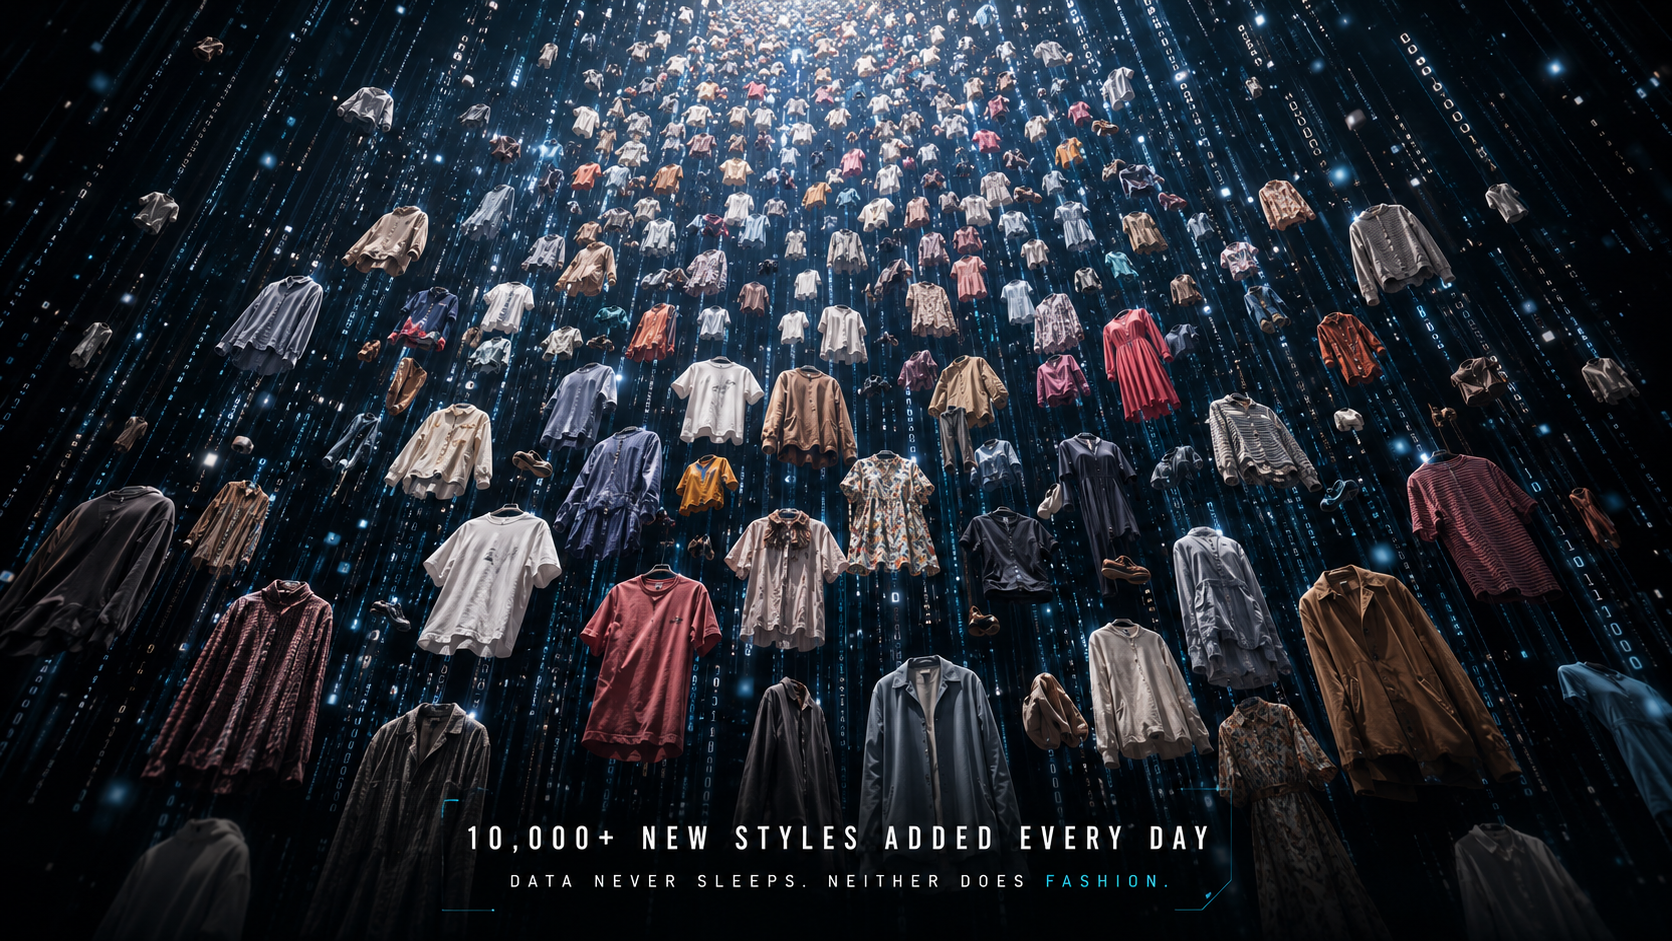
A digital waterfall of clothing items and data streams

Interactive Media Presentation

The Shein Shadow

A digital forensic investigation into how ultra-fast fashion turns attention, algorithms, logistics, and low prices into a global consumption machine.

Every product tile looks simple: a photo, a price, a discount, and a button. Behind that simplicity sits a complex system of trend detection, small-batch testing, supplier coordination, influencer promotion, and global delivery. This project follows that system from the first click to the afterlife of a garment.

Begin investigation
Story Roadmap

Follow the garment, not the advertisement.

This interactive story is structured like an investigation. It begins with the recommendation systems that detect demand, moves through influencer-driven desire, follows the supply chain route, then asks what the product page does not show: environmental waste, carbon impact, and evidence transparency.

The goal is not to accuse through fictional “leaks.” The visual assets are prototype illustrations. The analysis is grounded in academic research on Shein’s data-driven supply chain model and in scholarship on interactive scrollytelling as a method for guided digital narratives.

01The CodeAttention becomes data.
02The HaulInfluence turns trends into demand.
03The RouteDigital demand becomes physical movement.
04The CostThe product page hides the afterlife.
Chapter 01

The Code

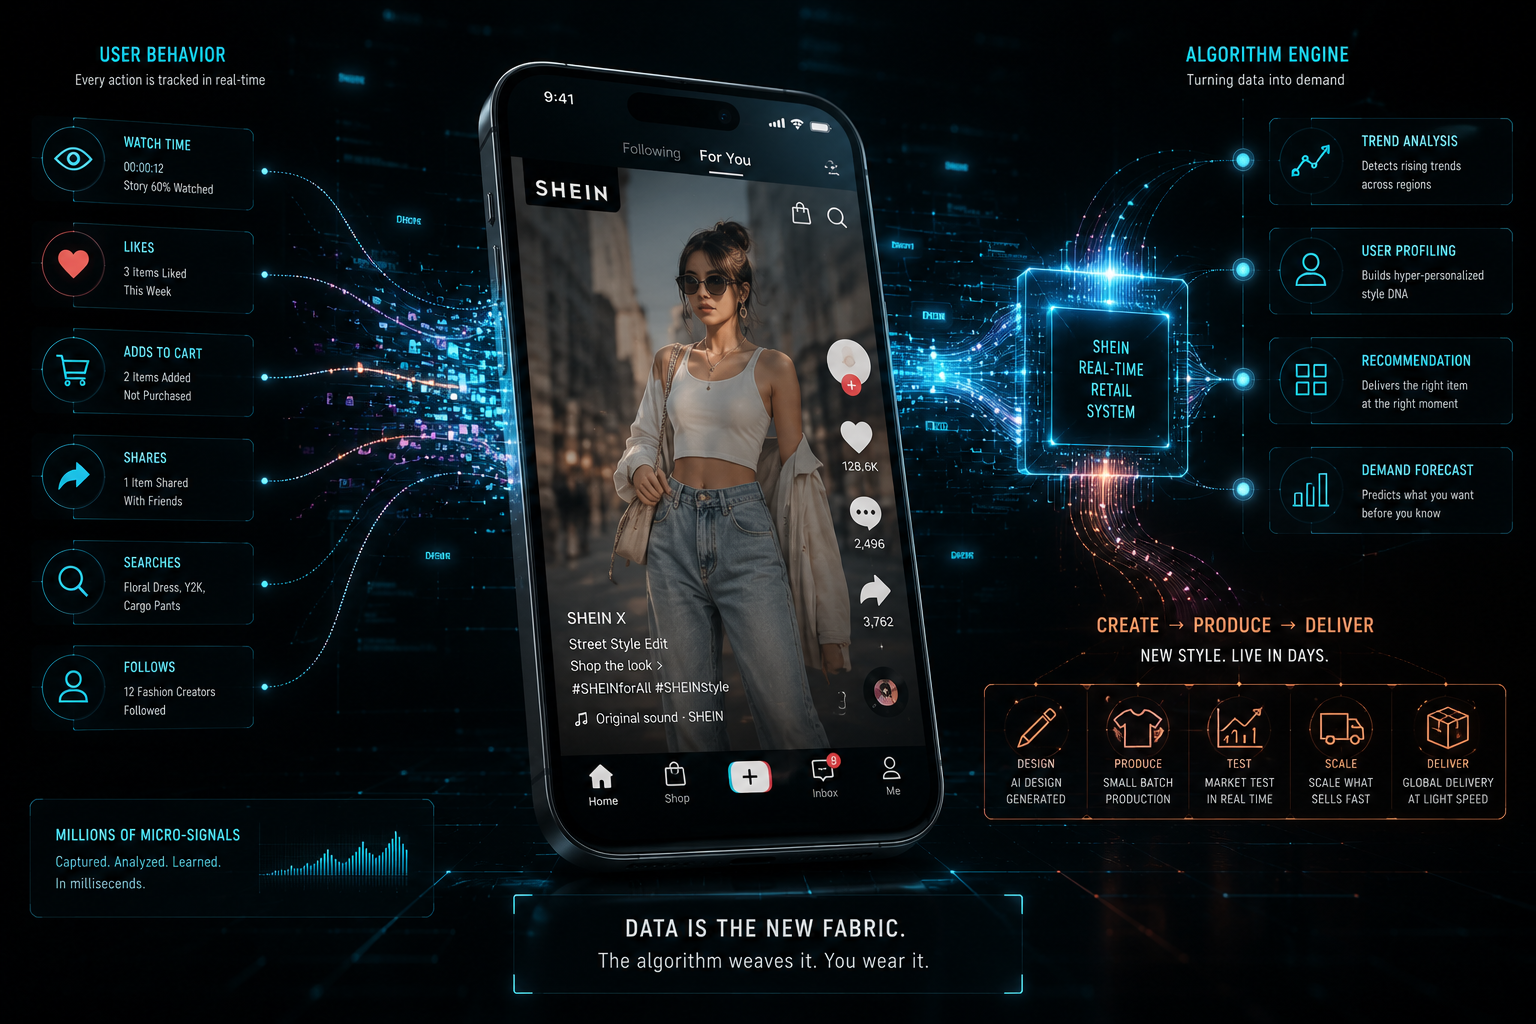
A smartphone surrounded by data signals and recommendation engine panels

Algorithmic Retail

Every click becomes a signal.

Ultra-fast fashion depends on speed, but speed begins before the factory. It begins when users browse, pause, search, like, save, and add products to cart. Each action can become a market signal. In Shein’s case, researchers describe a model shaped by digital transformation, real-time demand sensing, and supply-chain responsiveness.

Jin and Li (2025) argue that digital technology empowers Shein’s supply-chain business model by connecting data, production decisions, and market response. Sabio (2024) similarly frames Shein’s cross-border advantage around operational coordination, supplier networks, and rapid fulfillment. In plain terms, the interface is not only a storefront. It is also a sensor.

This chapter shows how consumer attention can be translated into prediction. The more people interact, the more the system learns which styles might be worth testing, scaling, or removing.

Interactive Loop

From scroll to new style.

The loop below breaks the process into six steps. It is simplified for classroom presentation, but it reflects the logic described across Shein supply-chain research: observe demand, test quickly, learn from feedback, and expand what sells.

Use the buttons to move through the sequence. The visualization updates as the story moves from consumer behaviour to production decision.

Scroll Like Watch Buy Recommend New style
Browsing creates the first behavioural signal.
Chapter 02

The Haul

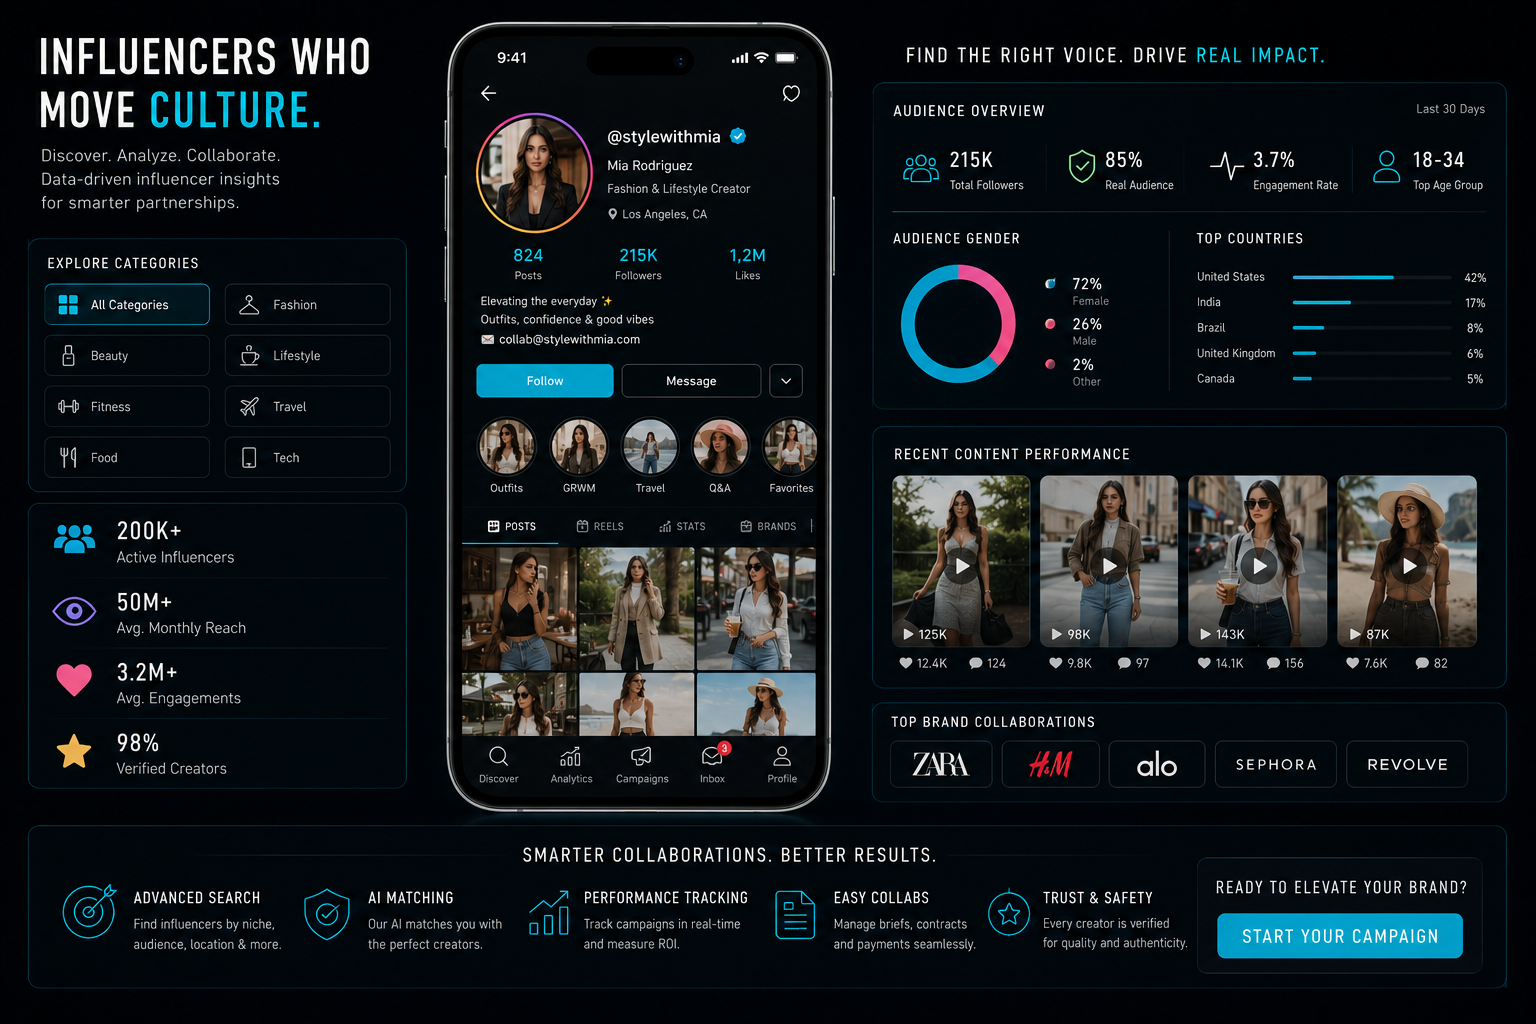
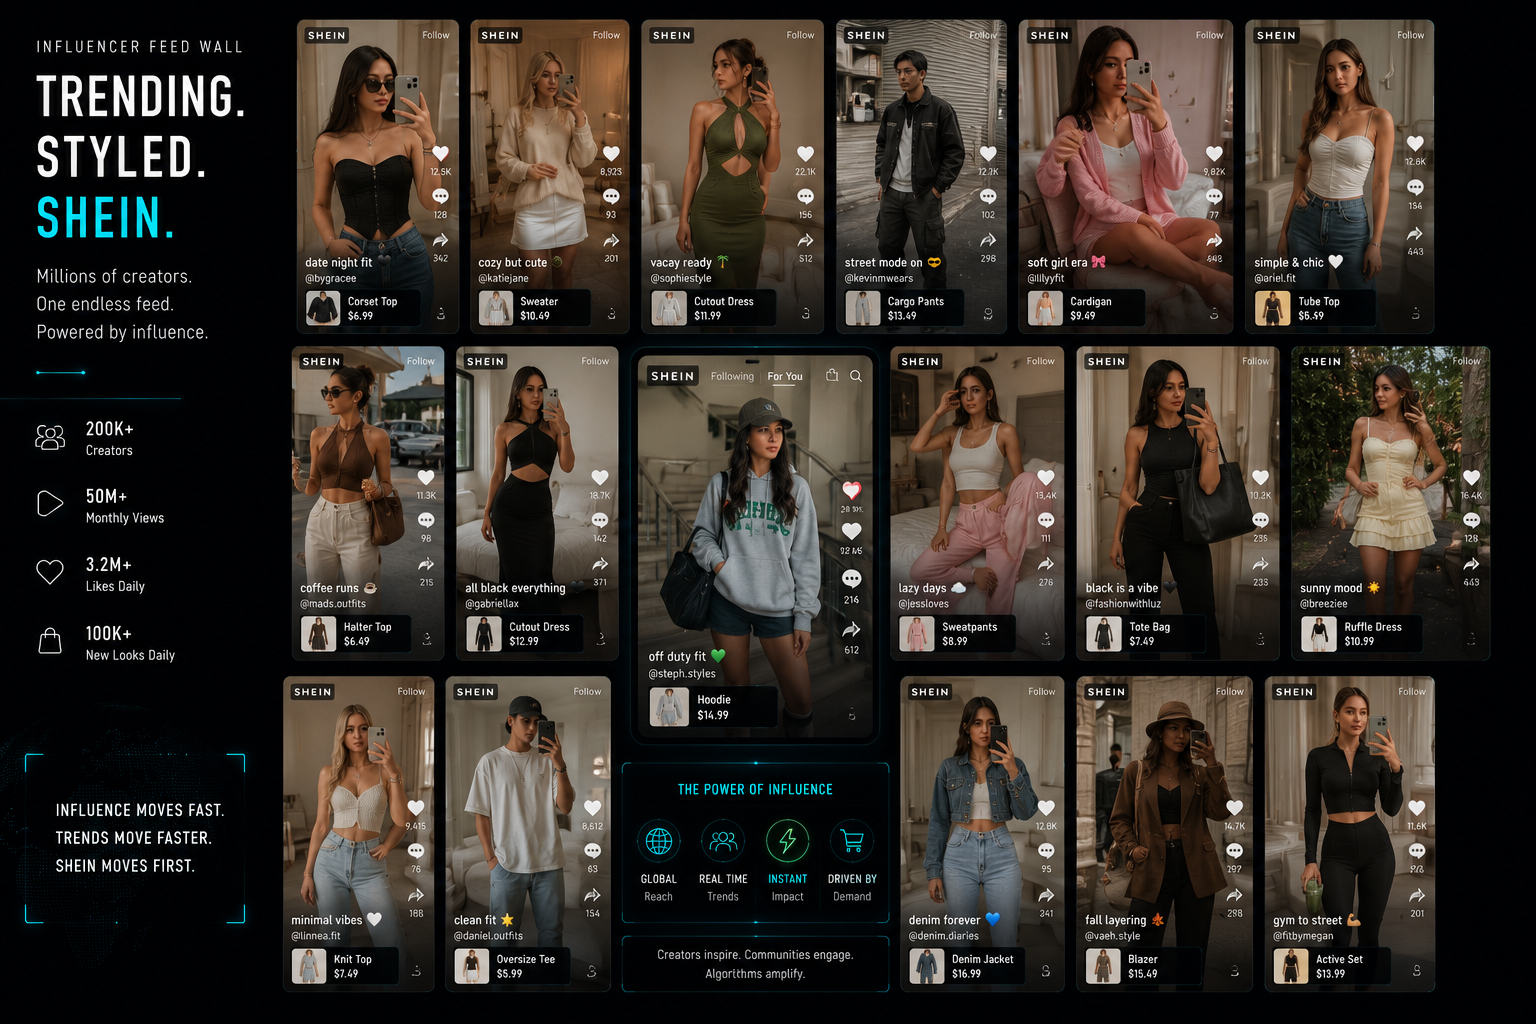
A wall of short-form influencer fashion posts

Influencer Culture

Desire becomes visible, measurable, and repeatable.

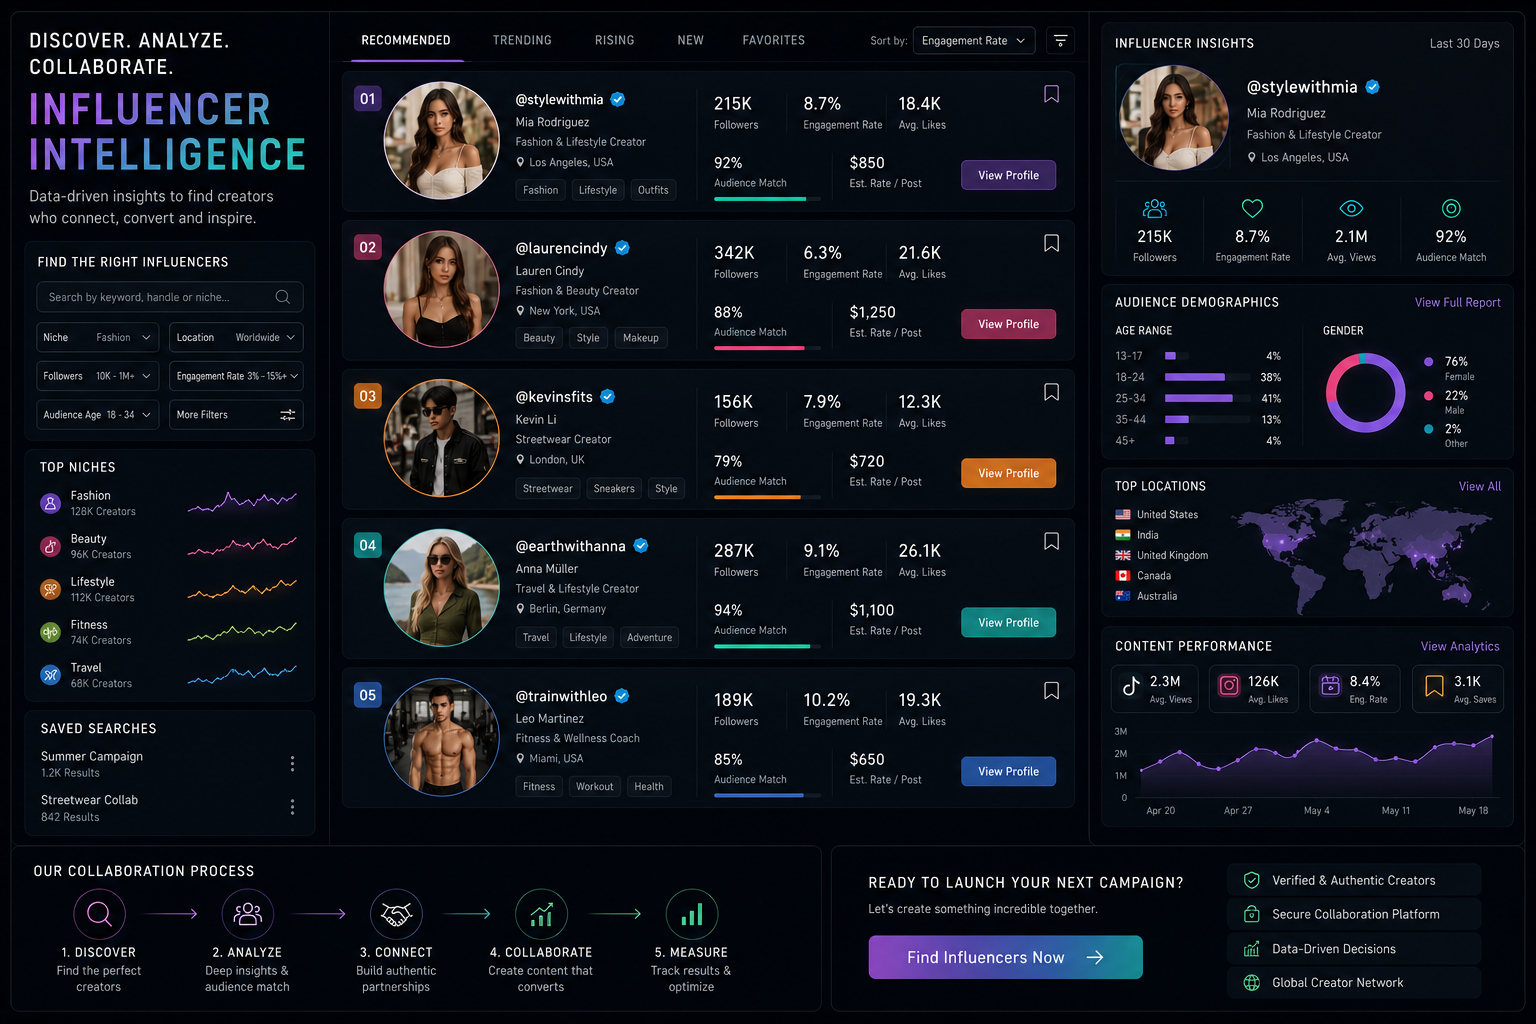
Fast fashion is not driven by supply chains alone. It also depends on cultural circulation. Influencers translate products into lifestyle narratives: date night, gym street, airport outfit, back-to-school haul. These micro-stories make clothing feel less like inventory and more like identity.

In this project, the influencer wall is an illustrative prototype, not a record of real creators. It shows how promotion, engagement metrics, and recommendation feeds can compress the distance between seeing and buying. Tang (2025) describes Shein’s model as part of a big-data-driven digital business ecosystem, where consumer behaviour, platform visibility, and business operations reinforce one another.

The “haul” is therefore more than a shopping format. It is a storytelling engine: each post becomes a proof point that the product is current, affordable, and socially validated.

Chapter 03

The Route

From Click to Doorstep

A digital decision becomes a physical journey.

When a product is scaled, the system shifts from prediction to execution. Design decisions become samples. Samples become small batches. Successful batches move through export hubs, freight networks, customs, and last-mile delivery.

Sabio (2024) emphasizes Shein’s cross-border e-commerce advantage through supply-chain coordination. Jin and Li (2025) describe digital transformation as a key driver of its model. This interactive route translates those ideas into movement.

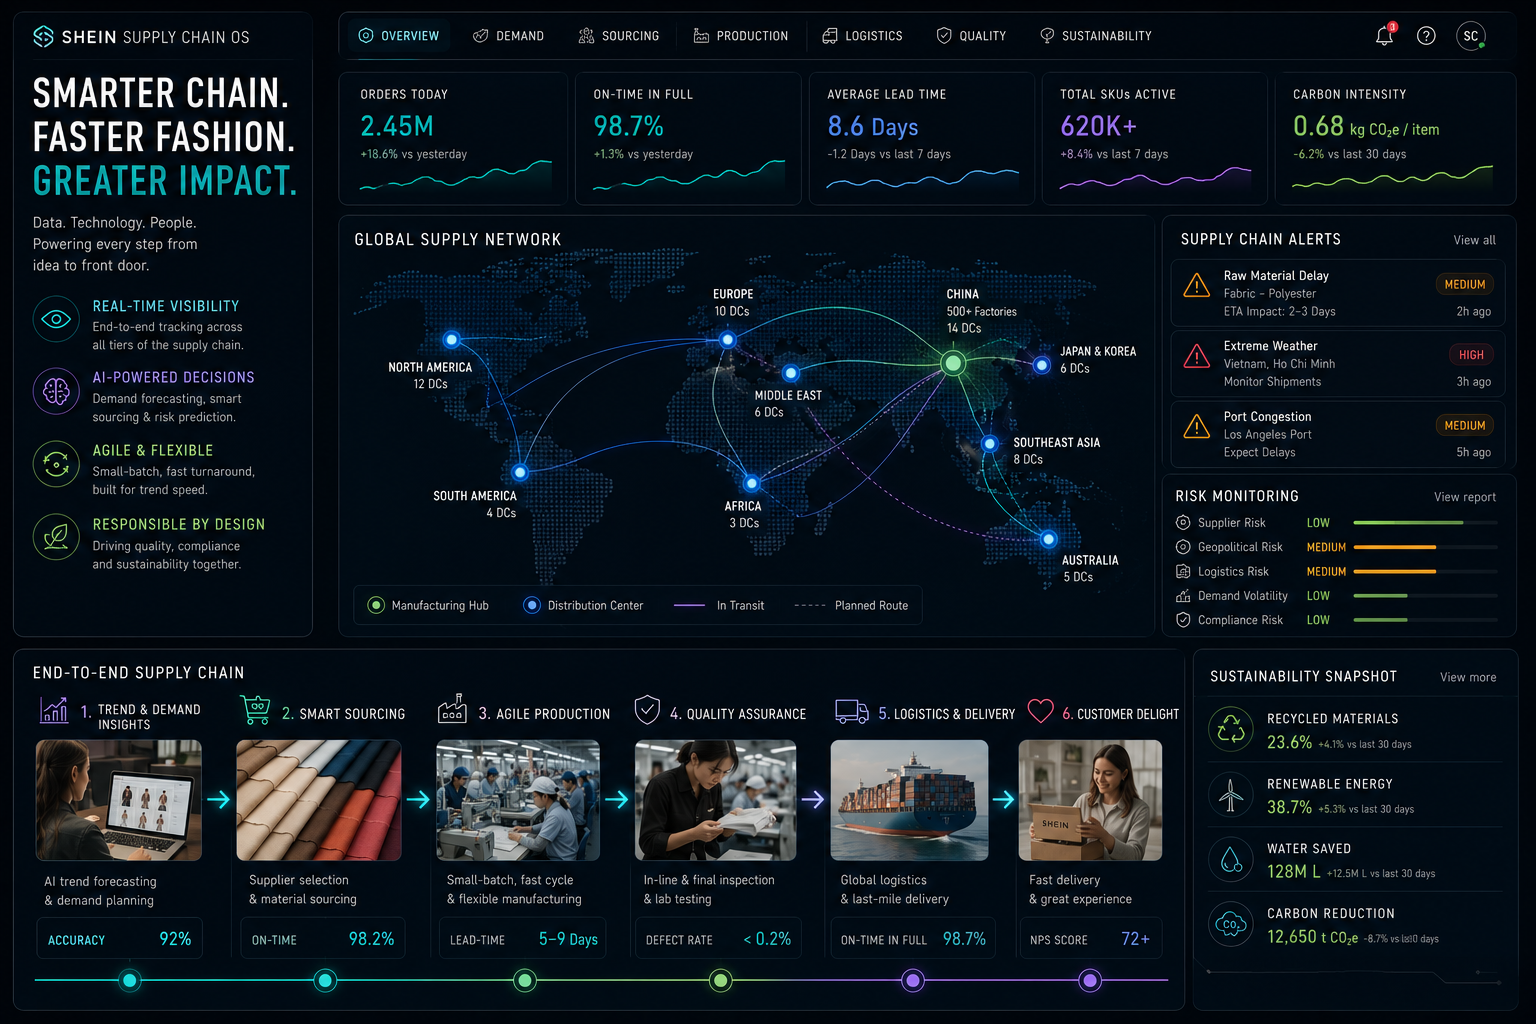
Global supply chain network
Stage 1: small-batch production responds to detected demand.
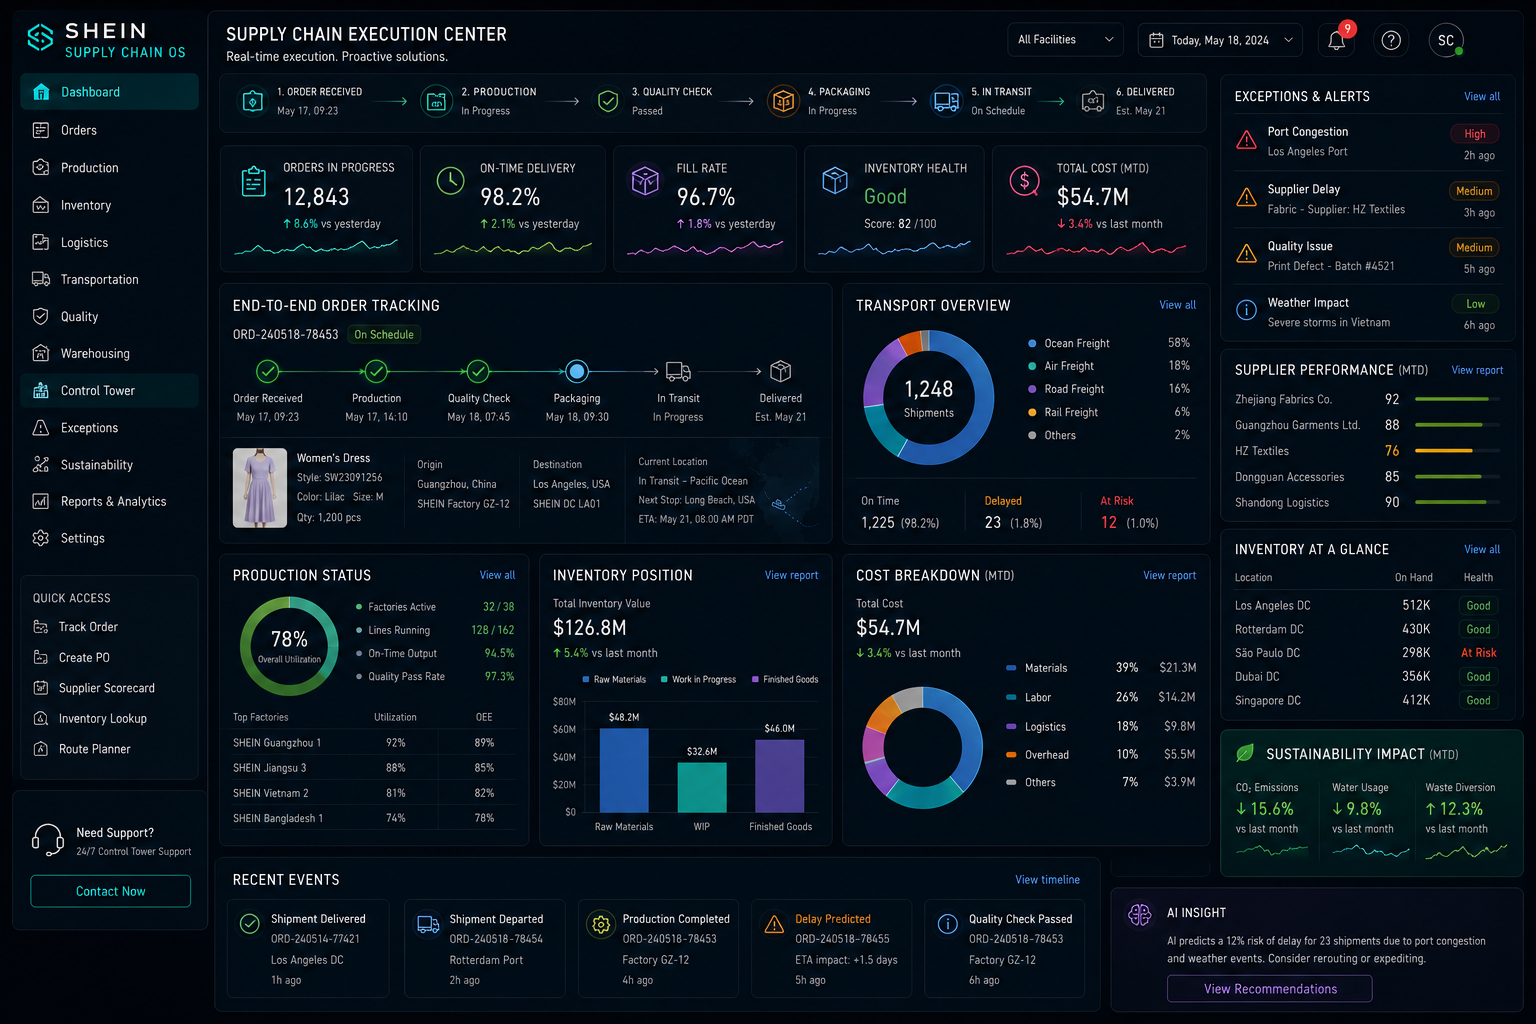
Supply chain execution center visual

Execution Layer

Speed is not one action. It is a chain of actions.

The supply chain image looks technical because the system itself is technical. But the story is human: a design appears because people clicked, the factory adapts because data suggests demand, and logistics respond because the business model depends on quick turnaround.

This is why scrollytelling is useful. Tjärnhage et al. (2023) argue that scrollytelling changes the reading experience by guiding attention through long-form digital journalism. Mörth et al. (2022) similarly describe guided dynamic narratives as a way to connect explanation with visual change.

Chapter 04

The Cost

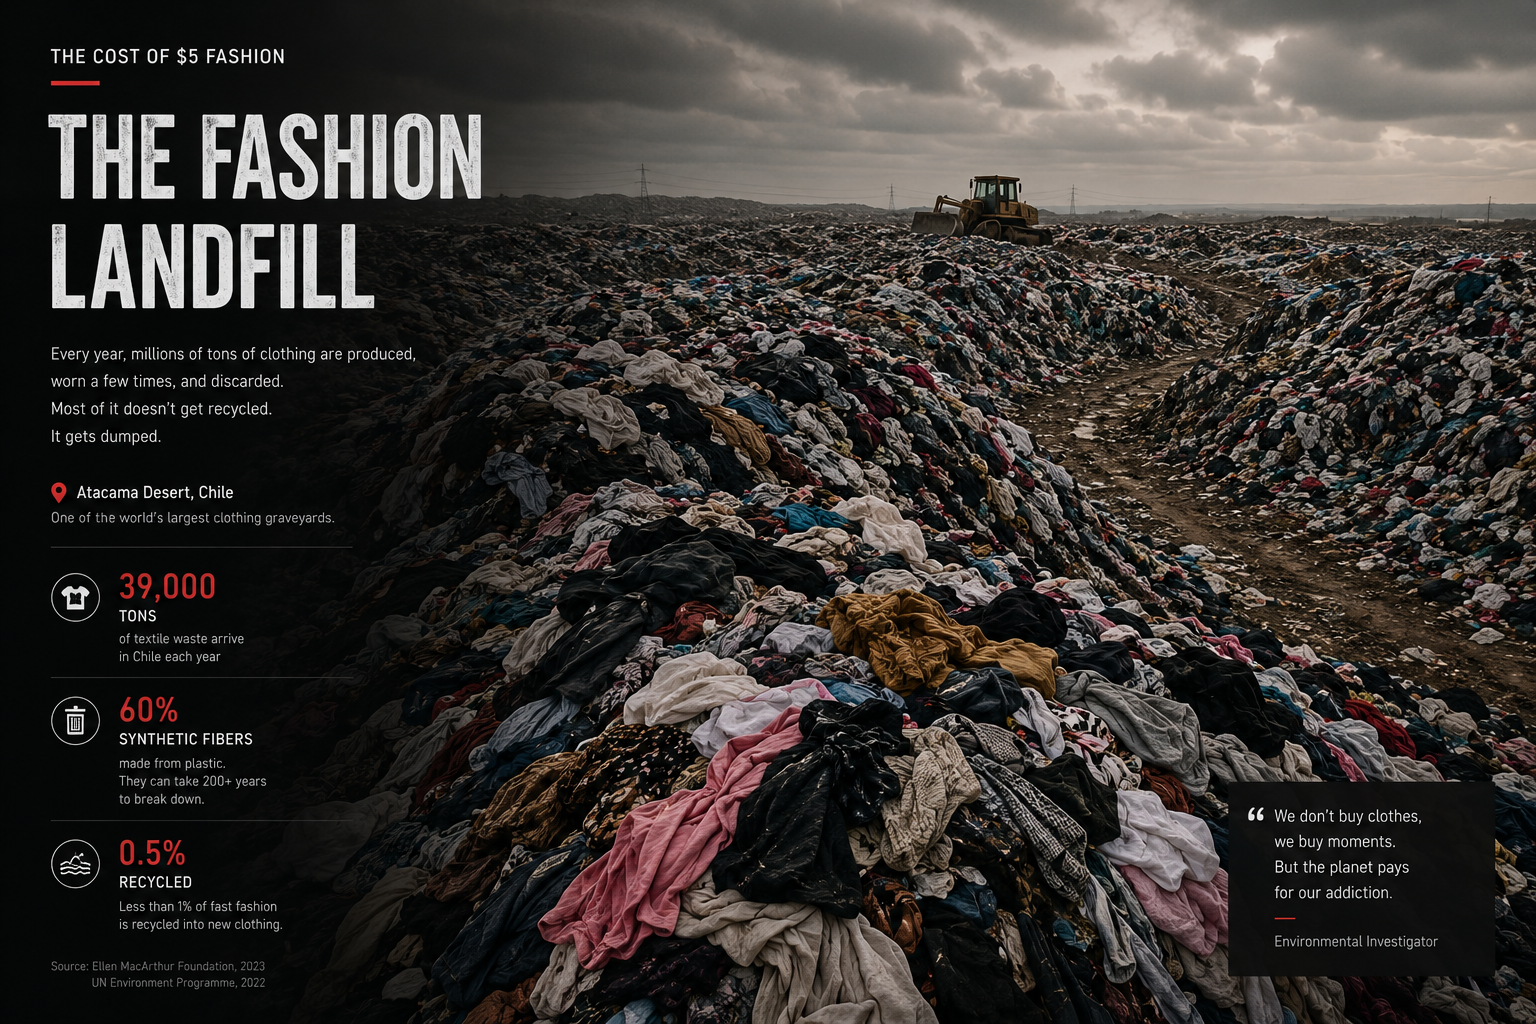
A documentary-style image of discarded clothing in a landfill

Environmental Afterlife

The product page does not show the afterlife.

The shopping interface focuses on desire: price, fit, colour, discount, shipping, and return policy. It rarely shows what happens after a garment loses social value, falls out of trend, or is discarded. This is where the story changes visually from digital dashboards to documentary evidence.

The landfill scene is not presented as a literal Shein facility. It represents the broader environmental consequence of high-volume fashion systems. The central issue is scale. When production accelerates and prices fall, consumers are encouraged to treat garments as temporary objects.

The section asks users to slow down and look past the surface of the product page. What looks affordable at checkout may have costs distributed across materials, transport, waste, and labour conditions.

Carbon Route

Every route leaves a footprint.

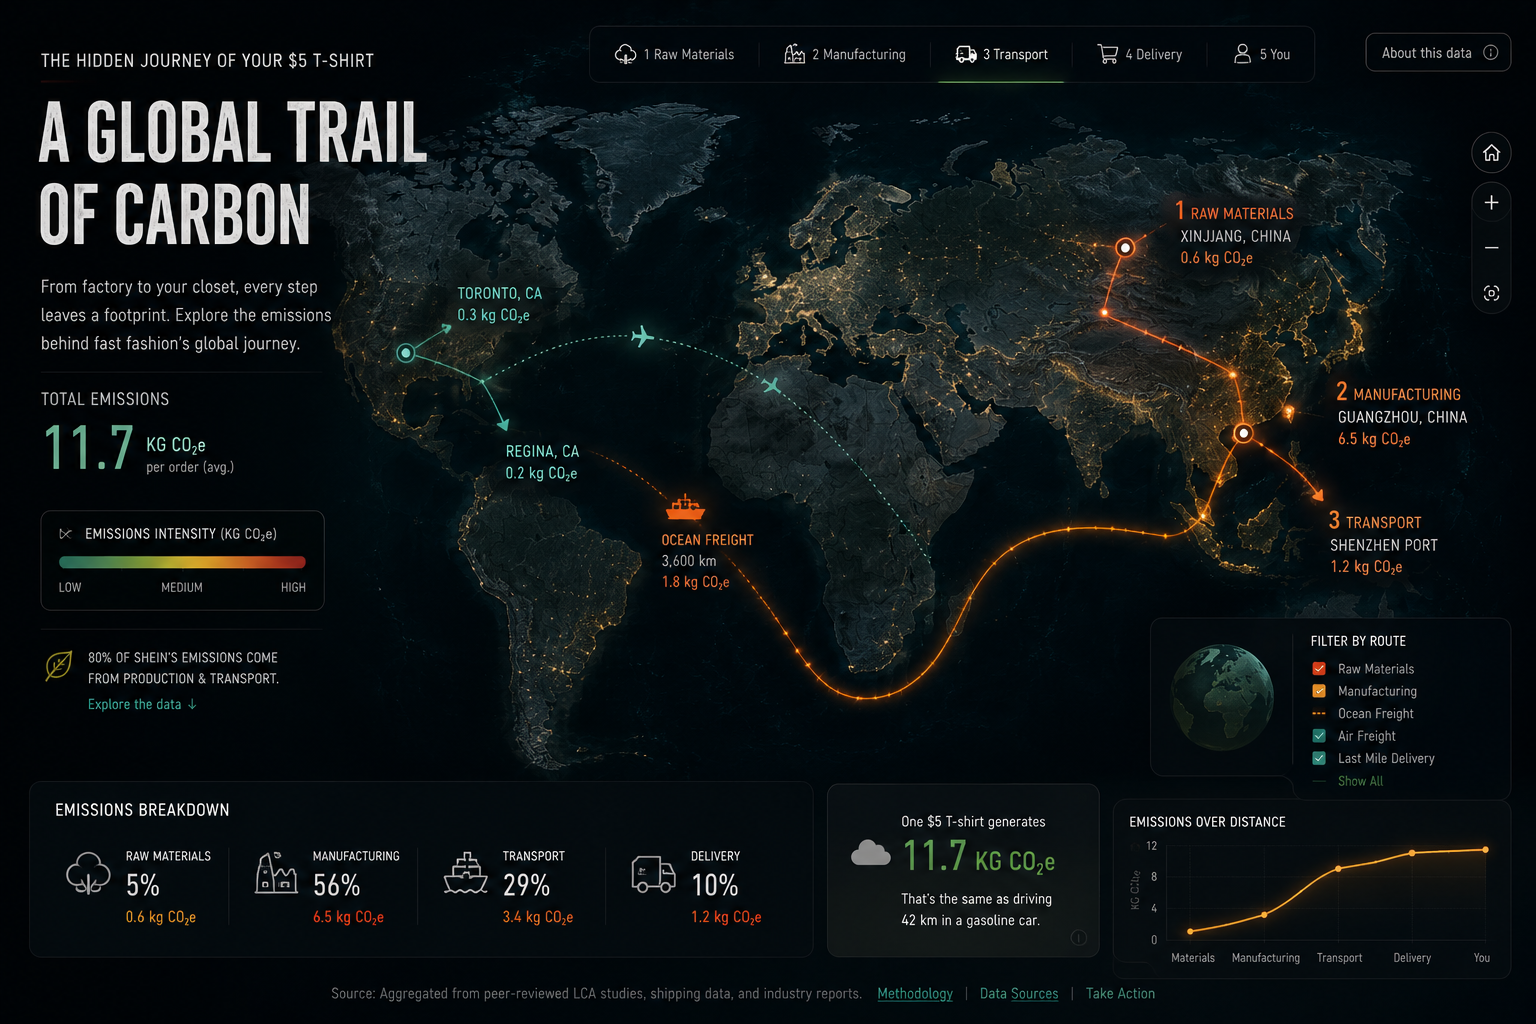
The carbon map is used as a visual prompt, not as an exact lifecycle assessment. To avoid double-text and conflicting numbers, this section separates the image from the native counters. The counters below are clearly labelled as illustrative estimates for demonstration, not verified measurements of a specific product.

In the final presentation, this distinction matters. Academic storytelling should make uncertainty visible rather than hide it inside a confident graphic.

ManufacturingHigh impact
TransportVariable
WasteLong term
A carbon route map showing garment journey across regions

Transparency Slider

What you see versus what is hidden.

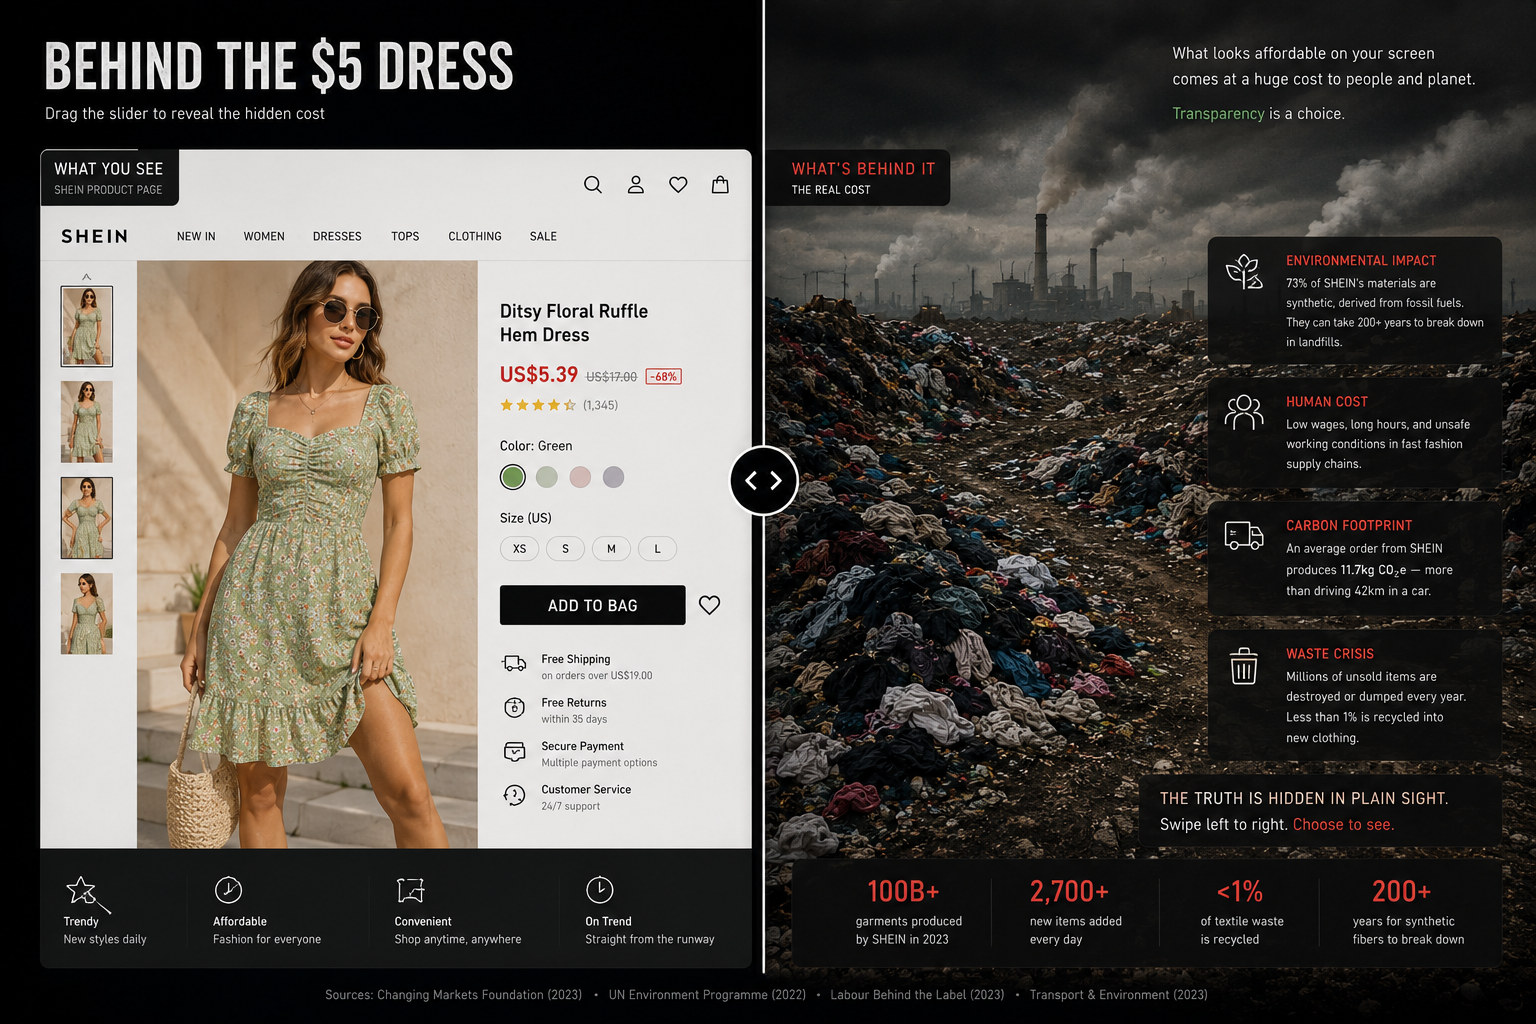
Drag the slider. The interaction contrasts the polished consumer interface with a darker system view. It does not claim that one product image proves a full supply-chain reality. Instead, it dramatizes a research question: what would change if product pages made environmental and labour context as visible as price?

Comparison of product page and hidden environmental cost
Chapter 05

The Evidence Room

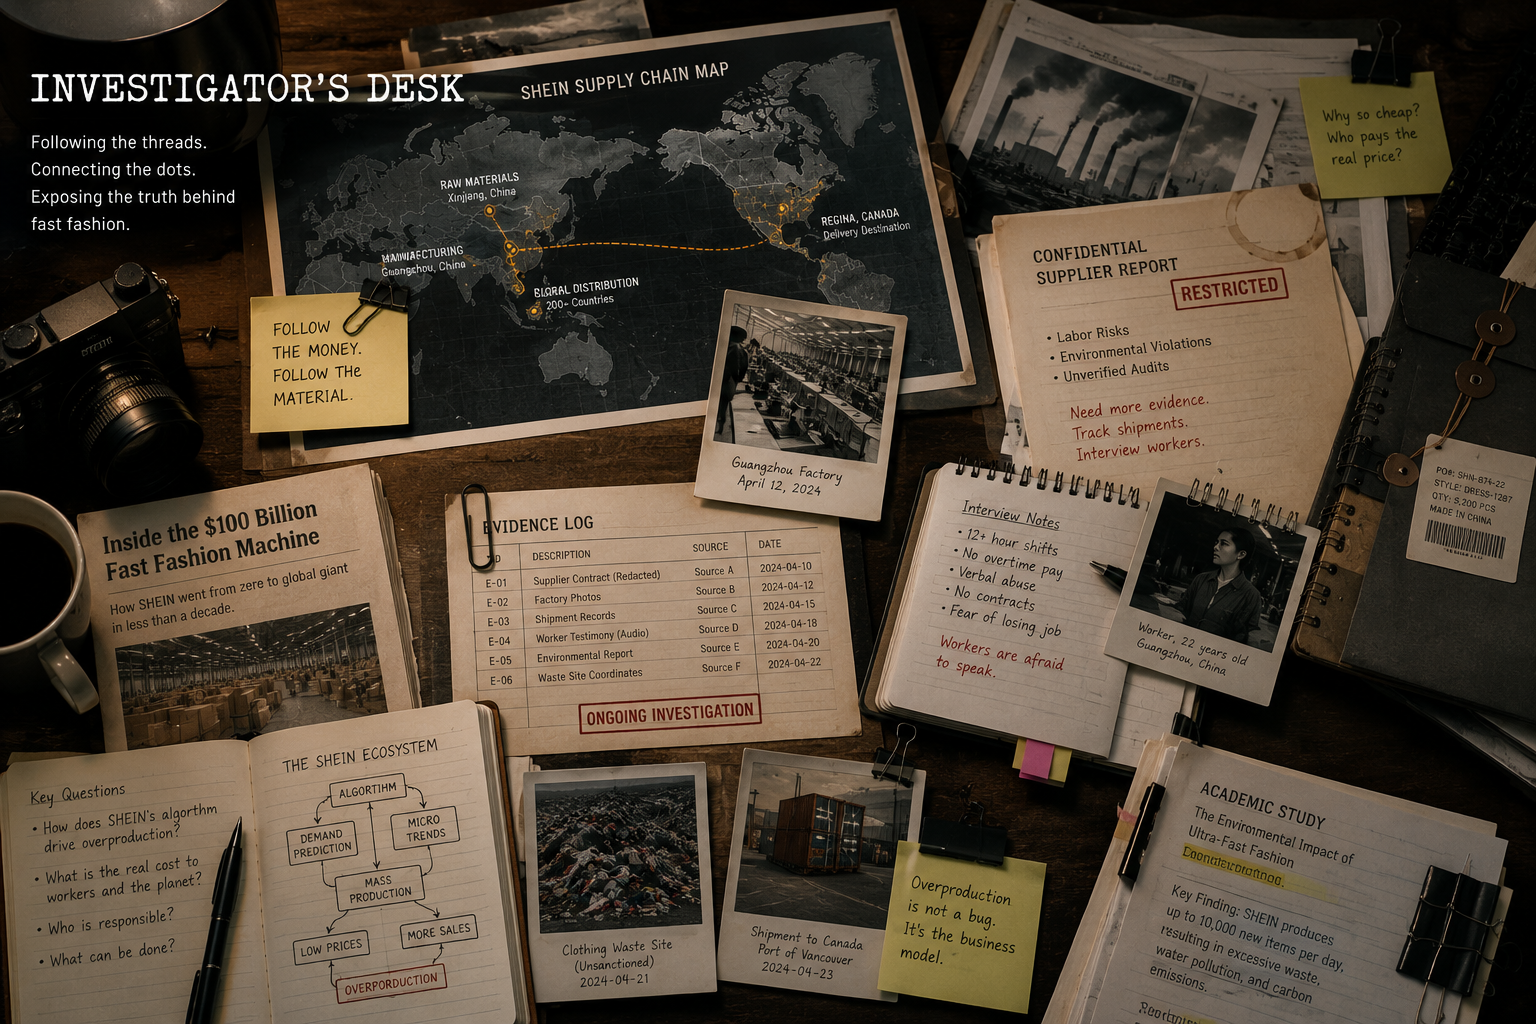
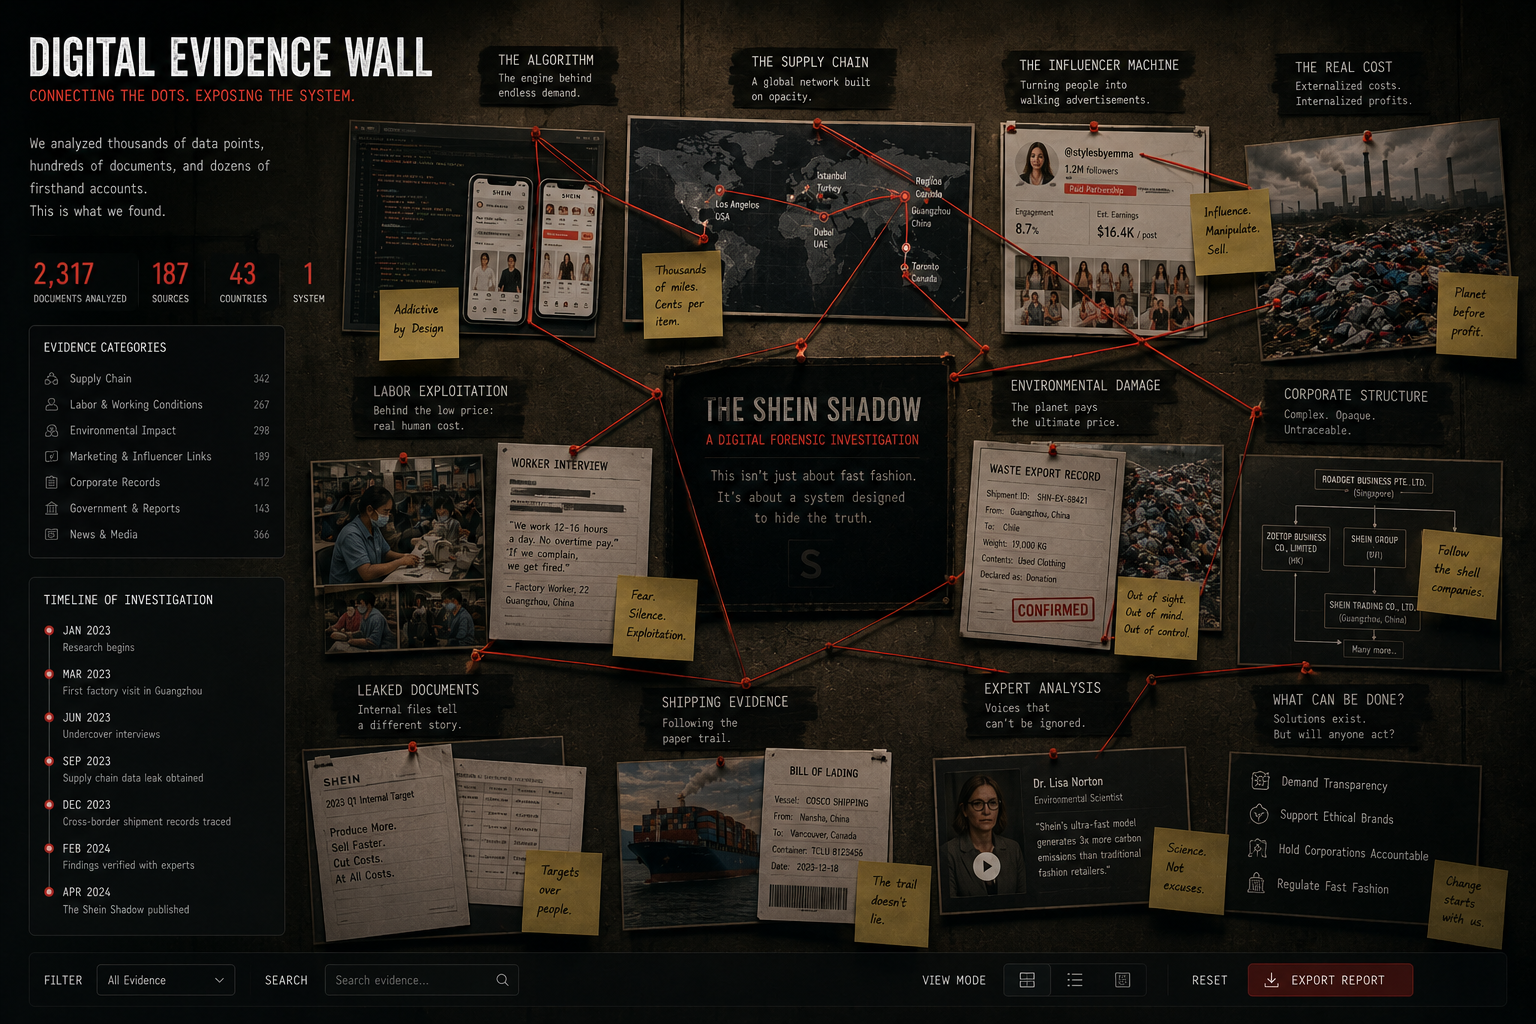
A fictional investigator desk with documents and maps

Prototype Evidence

Illustrations are not leaked documents.

The desk scene is a fictional visual metaphor built for this academic prototype. The documents, worker notes, and investigation labels are not presented as real leaked records. Their purpose is to show how a digital investigation might organize questions around supply chain, labour, environment, and accountability.

This distinction protects the integrity of the project. The evidence used for argument comes from academic sources and cited research, while the images help create an immersive investigative mood.

A fictional digital evidence wall connecting fashion systems

Digital Evidence Wall

Connected systems create connected impacts.

The board gathers four systems into one readable map: algorithmic retail, influencer culture, supply-chain logistics, and environmental cost. It is a visual synthesis, not a factual leak file.

The value of the evidence wall is relational. It helps the audience see that ultra-fast fashion cannot be understood through one dashboard or one product page. The system works because many parts reinforce one another.

Chapter 06

The Verdict

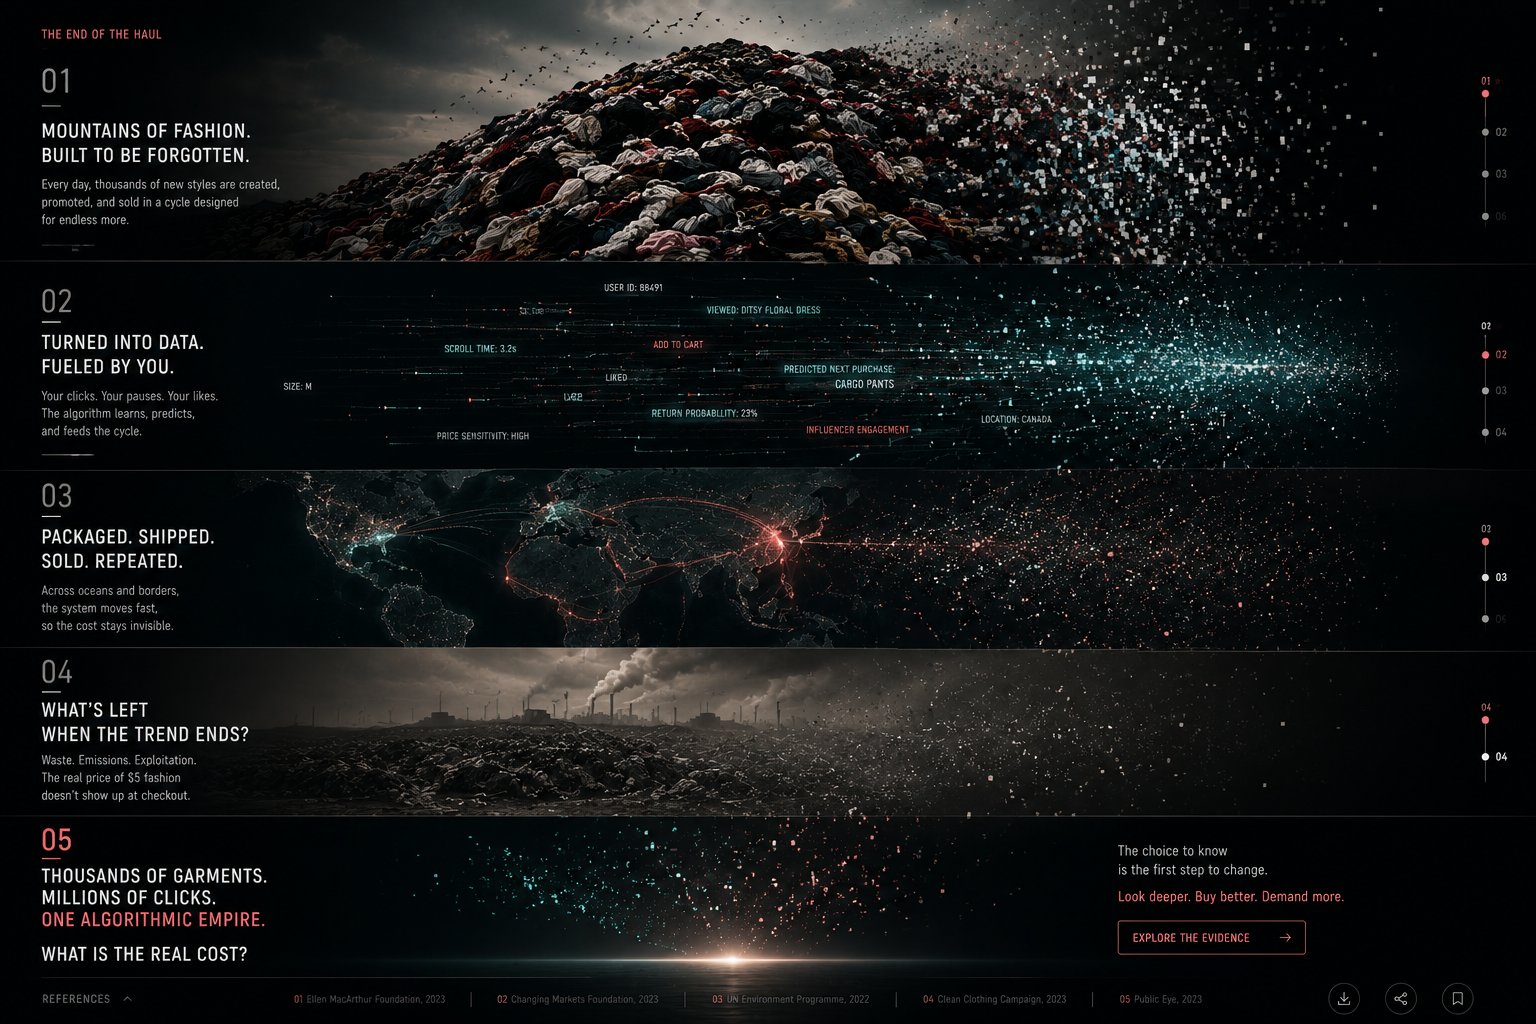
Fashion dissolving into data and environmental imagery

Final Verdict

Thousands of garments. Millions of clicks. One algorithmic empire.

This investigation shows how digital media can make hidden systems visible. The same interface that invites users to browse can also be redesigned to reveal context: production speed, shipping complexity, environmental uncertainty, and the limits of transparency.

Interactive storytelling matters because it gives the reader a role. By scrolling, clicking, comparing, and opening evidence, the audience does not only consume information. They participate in uncovering it.

References

Sabio, C. J. (2024). Cross-Border E-Commerce Revolution: Analyzing Shein’s supply chain advantage.

Jin, H., & Li, Y. (2025). Research on the innovation path of SHEIN’s supply chain business model empowered by digital technology.

Tang, W. (2025). Analysis of the construction logic of big data-driven digital business ecosystem and SHEIN model.

Tjärnhage, A., Söderström, U., Norberg, O., Andersson, M., & Mejtoft, T. (2023). The impact of scrollytelling on the reading experience of long-form journalism.

Mörth, E., Bruckner, S., & Smit, N. N. (2022). ScrollyViS: Interactive visual authoring of guided dynamic narratives for scientific scrollytelling.

Design and ethics note

This project is an academic prototype. AI-generated images are used as illustrative assets. They should not be interpreted as leaked documents, real worker testimony, verified internal records, or direct evidence against any named company. Analytical claims are grounded in the listed academic sources.